EFFECT OF FACTORS ON THE RATE OF REACTION
s*SURFACE AREA OF SOLID:
sSURFACE AREA OF SOLID |
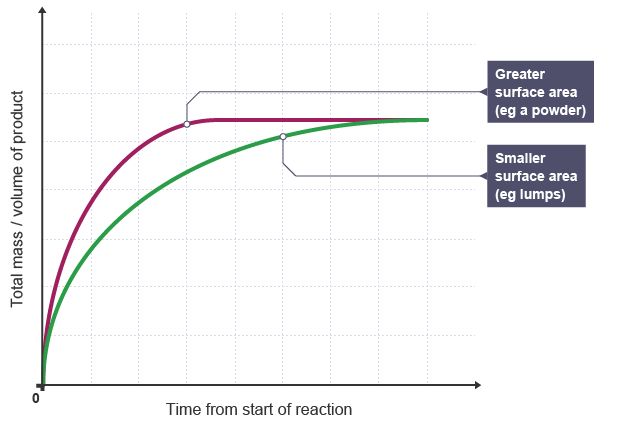
Graph showing the Effect of Surface Area on the Rate of Reaction |
EXPLANATION:
|
s*CONCENTRATION OF A SOLUTION:sCONCENTRATION OF A SOLUTION |

Graph showing the Effect of Concentration on Rate of Reaction |
EXPLANATION:
Compared to the reaction with low concentration of reactant, the graph with high concentration of reactant has a steeper gradient at the start, and plateaus faster This shows that as the concentration of a solution increases, the rate of reaction will increase (positive correlation)
|
s*PRESSURE OF A GAS:sPRESSURE OF A GAS |
Graph showing the Effect of Pressure on the Rate of Reaction |
EXPLANATION:
Compared to the reaction using gas at low pressure, the graph of reaction using gas at high pressure has a steeper gradient at the start, and plateaus faster This shows that as the pressure of gas increases, the rate of reaction will increase
|
s*TEMPERATURE:sTEMPERATURE |
Graph showing Effect of Temperature on Rate of Reaction |
EXPLANATION:
Compared to the reaction at low temperature, the graph for reaction at high temperature has a steeper gradient, and plateaus faster This shows that as temperature increases, the rate of reaction will increase
|
s*USE OF A CATALYST:sTEMPERATURE |
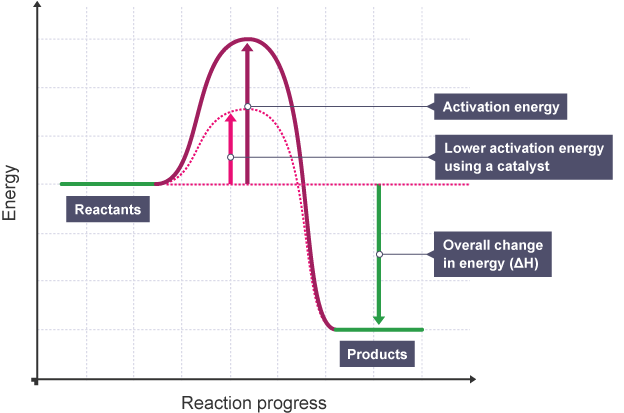
Graph showing Effect of Catalyst on Rate of Reaction |
EXPLANATION:
The diagram shows that when a catalyst is used, the activation energy - certain amount of energy needed for reaction to proceed, is reduced as it creates an alternative pathway requiring lower activation energy (shown by dotted graph with lower maximum energy level), Allowing More Successful and Frequent Collisions - This allows more frequent successful collisions to occur, increasing the rate of reaction
This shows that when a catalyst is used, the rate of reaction increases
|


No comments:
Post a Comment